Package allows analysis and visualization on the fly via web


Computational scientists have a new weapon at their disposal.


On February 1, the Electronic Simulation Monitoring (eSiMon) Dashboard version 1.0 was released to the public, allowing scientists to monitor and analyze their simulations in real-time.


Developed by the Scientific Computing and Imaging Institute at the University of Utah, North Carolina State University, and Oak Ridge National Laboratory (ORNL), this “window” into running simulation shows results almost as they occur, displaying data just a minute or two behind the simulations themselves. Ultimately, the Dashboard allows the scientists to worry about the “science” being simulated, rather than learn the intricacies of supercomputing such as file systems and directories, an increasingly complex area as leadership systems continue to break the petaflop barrier.


In my experience, Dashboard has been an essential tool for monitoring and controlling the large-scale simulation data from supercomputers,” said Seung-Hoe Ku, an assistant research professor at New York University’s Courant Institute of Mathematical Sciences who uses the Dashboard to monitor simulations of hot, ionized gas at the edge of nuclear fusion reactors, an area of great uncertainty in a device that could one day furnish the world with a nearly limitless abundance of clean energy. “The FLASH interface provides easy accessibility with web browsers, and the design provides a simple and useful user experience. I have saved a lot of time for monitoring the simulation and managing the data using the Dashboard together with the EFFIS framework."
 

According to team member Roselyne Tchoua of the Oak Ridge Leadership Computing Facility (OLCF),the package offers three major benefits for computational scientists: first and foremost, it allows monitoring of the simulation via the web. It is the only single tool available that provides access andinsight into the status of a simulation from any computer on any browser; second, it hides the low-leveltechnical details from the users, allowing the users to ponder variables and analysis instead ofcomputational elements; and finally, it allows collaboration between simulation scientists from different areas and degrees of expertise. In other words, researchers separated geographically can see the samedata simultaneously and collaborate on the spot.


Furthermore, via easy clicking and dragging, researchers can generate and retrieve publication-quality images and video. Hiding the complexity of the system creates a lighter and more accessible web portal and a more inclusive and diverse user base.


The interface offers some basic features such as visualizing simulation-based images, videos and textual information. By simply dragging and dropping variable names from a tree view on the monitoring page onto the main canvas, users can view graphics associated with these variables at a particular time stamp.Furthermore, they can use playback features to observe the variables changing over time.


Researchers can also take electronic notes on the simulation as well as annotate movies. Other features include vector graphics with zoom/pan capabilities, data lineage viewing, and downloading processed and raw data onto local machines. Future versions will include hooks into external software and user-customized analysis and visualization tools.


“We are currently working on integrating the eSiMon application programming interface into an ADIOS method so that ADIOS users automatically get the benefit of monitoring their running simulation,” said the OLCF’s Scott Klasky, a leading developer of ADIOS, an open-source I/O performance library.


The “live” version of the dashboard is physically located at Oak Ridge National Laboratory (ORNL)and can be accessed with an OLCF account at https://esimmon.ccs.ornl.gov. This version of the dashboard gives an overview of ORNL and National Energy Research Scientific Computing Center computers. Users can quickly determine which systems are up or down, which are busy and where they would like to launch a job. Users can also view the status of their running and past jobs as well as those of their collaborators.


However, a portable version of eSiMon is also available for any interested party, and the platform cuts across scientific boundaries so that the Dashboard can be used for any type of scientific simulation. For information on acquiring and/or using the eSiMon dashboard, visit http://www.olcf.ornl.gov/center-projects/esimmon/.


Scripps researcher adapts global climate model to improve regional predictions


Catalina eddy

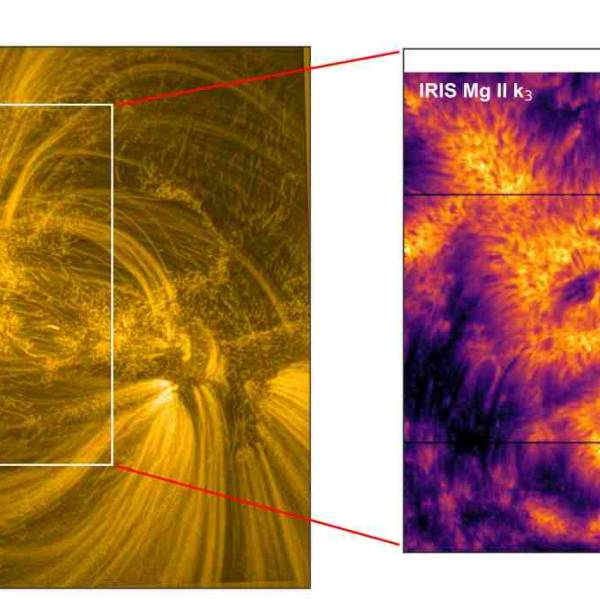
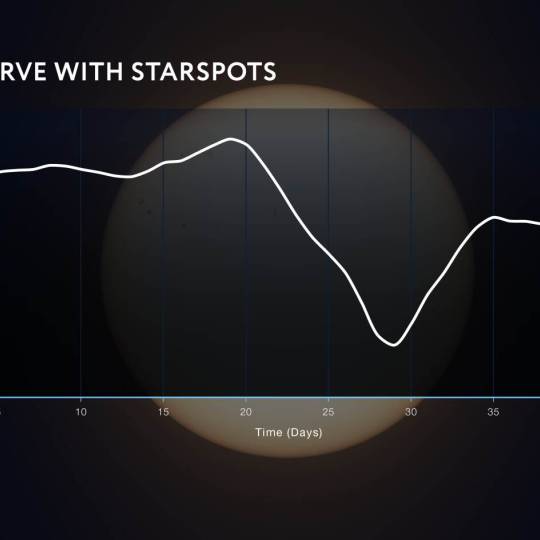
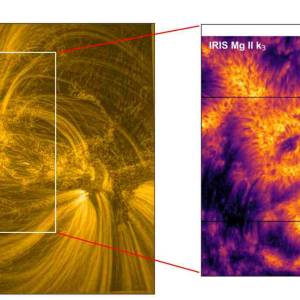
A demonstration of what the dynamical downscaling can achieve. The center figure is the coarse resolution analysis used to force the high resolution model. The left figure is the output from Kanamitsu's downscaling which produces an eddy. This eddy is famous in Southern California due to the very cloudy and cold weather during the May-June period. The right figure is the regional scale analysis performed by National Weather Service, which utilized local observations.

“You don't need a weatherman to know which way the wind blows," Bob Dylan famously sang. But if you want to know how the wind will blow tomorrow, odds are you’re going to check the forecast.

Atmospheric prediction has improved immeasurably in the 45 years since Dylan sang "Subterranean Homesick Blues." Whether you’re interested in tomorrow’s high or the global heat index a decade from now, forecasters can now predict the climate with far greater accuracy.

The rise of powerful high performance computers has been a large part of these improvements. Scientists isolate the factors that influence the weather (heat, radiation, the rotation of the Earth), transform them into mathematical formulae, and use supercomputers to forecast the atmosphere in all its multifarious complexity.

And yet, these forecasts are still painted with a fairly large brush. The global models — upon which all official predictions are based — have a resolution on the order of 100 kilometers (km) per grid-point. At that level, storms appear as undifferentiated blobs and towns in the mountains and the valley seem to experience identical weather.

“You can’t accurately examine how river flows have changed over the last 50 years, because one grid point may contain many rivers,” Masao Kanamitsu, a veteran of the atmospheric modeling world and a leading researcher at Scripps Institution of Oceanography, said.

Catalina eddyA recent study of the Catalina Eddy performed by Kanamitsu. The figure shows the 3-hourly evolution of the eddy during two days. Kanamitsu discovered that the eddy disappears during 00Z and 03Z, which was never been reported before. This was due to the lack of high time-resolution observations. This kind of analysis is only possible using the dynamically downscaled analysis.

Kanamitsu was a teenager in Japan in the 1960s when he read about the first computer weather forecasts. He knew immediately that computational forecasting was what he wanted to do. He worked his way through the world’s most advanced weather research centers, first in Japan, then in Europe and most recently in the U.S. In 1994, he published a paper, “The NMC Nested Regional Spectral Model,” with his colleague Dr. Henry Juang describing the regional spectral model, an idea for how to narrow the lens of forecasts, that is one of the most cited papers in the field.

In the early to mid-1990s, Kanamitsu used Cray supercomputers and Japan’s Earth Simulator to run climate simulations. Today, he uses the Ranger supercomputer at the Texas Advanced Computing Center (TACC), the second largest supercomputer on the National Science Foundation’s TeraGrid.

Kanamitsu and others in the atmospheric community use a process calleddownscaling to improve regional predictions. This technique takes output from the global climate model, which is unable to resolve important features like clouds and mountains, and adds information at scales smaller than the grid spacing.

“You’re given large scale, coarse resolution data, and you have to find a way to get the small scale detail. That’s downscaling,” he said.

Kanamitsu is using the method to create improved regional models for California, where small-scale weather patterns play a large role in dictating the environment of the state’s many microclimates. By integrating detailed information about the topography, vegetation, river flow, and other factors into the subgrid of California, Kanamitsu is achieving a resolution of 10 kiolmeters (km) with hourly predictions, using a dynamical method. This means that the physics of nature are included in the simulations — rain falls, winds blow — in contrast to statistical methods that use observational data in lieu of atmospheric physics.

“We’re finding that downscaling works very well, which is amazing because it doesn’t use any small-scale observation data,” Kanamitsu said. “You just feed the large-scale information from the boundaries and you get small-scale features that match very closely with observations.”

The tricky part involves representing the points where the forces outside California (the global model) interact with the forces inside the region (LA smog, for instance). These are integral for successful modeling, and difficult mathematically to resolve. Recent papers by Kanamitsu and his collaborators describe a nudging technique used to reduce the difference between the inner and outer conditions.

Kanamitsu is also tackling the problem of connecting atmospheric conditions with the ocean, which borders much of California, but is typically only included very coarse resolution ocean simulations.

“Along the coast of California, there’s a cold ocean that interacts with the atmosphere at very small scales,” he said. “We’re trying to simulate the ocean current and temperature in a high resolution ocean model, coupled with a high resolution atmospheric model, to find out what the impact of these small scale ocean states are.”

Catalina eddyUnderstanding Weather by O.G. Sutton, published in 1960, was an early inspiration for Kanamitsu.

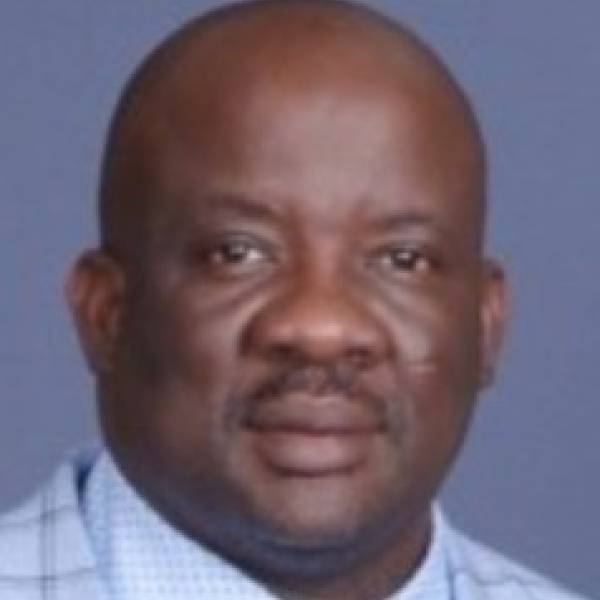
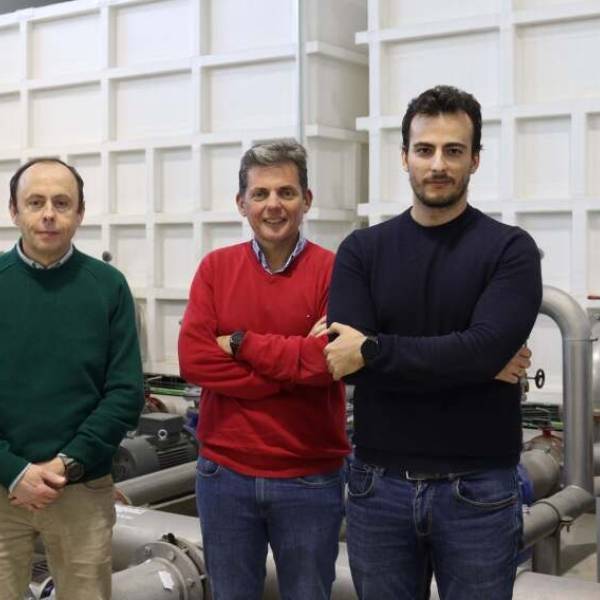
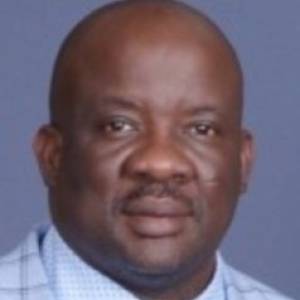
Coupling these models requires very powerful and tightly connected computing systems like Ranger at TACC, which is one of the most efficient machines for producing long historical downscaling in a short period of time. Kanamitsu's simulations improve upon those currently in use by the National Weather Service, leading to 10 papers on the subject in 2010.

Researchers have already begun applying the downscaling to fish population studies, river flow changes, and wind energy applications.

“Kanamitsu's model simulations have enabled a much better resolved picture of mesoscale processes affecting wind flow and precipitation in the contemporary, historical period in California," noted Scripps hydrometeorologist Daniel Cayan, one of Kanamitsu’s colleagues. They also provide insight into regional scale climate changes that may occur over the State.”


Even Kanamitsu’s 10km resolution models aren’t accurate enough to answer some important questions.

Masao KanamitsuMasao Kanamitsu, a researcher at Scripps Institution of Oceanography.

“Applications for wind power, we found out, require very high resolution models,” Kanamitsu said. “The wind is very local, so the ultimate goal is one kilometer resolution.”

The time-scale resolution is an important factor as well. Severe weather events like tornadoes happen fast, and achieving shorter time-scale forecasts is another of Kanamitsu’s goals.

The list of factors that could be added to the models is endless, but over the course of his long career, Kanamitsu has witnessed how improved computer modeling has changed his field.

“Thirty years ago, I was one of the forecasters,” he recalled. “There was a forecaster’s meeting every day and we took our computer model results to the meeting. Back then, the forecaster in charge didn’t look at or believe in our results. But now, forecasters believe in the models so much that some people think they’re losing their skill.”

As scientists seek to determine the local impact of global climate change and address the issue, an accurate historical record and sophisticated regional forecasts like those facilitated by Kanamitsu’s work are increasingly crucial.

Ice sheets in Glacier Bay National Park are subject to dynamics that SEACISM researchers simulate on leadership-class supercomputers. (Image courtesy of Kate Evans)
Recently, Rhode Island-sized chunks of ice have separated from Greenland and Antarctica, garnering worldwide attention. But is this calving due to typical seasonal variations or a long-term warmer world? Climate scientists already use ice sheet models to better understand how ice loss affects sea levels; however, those models are not easily adapted for use in global climate models. In August the Scalable, Efficient, and Accurate Community Ice Sheet Model project began on Jaguar, one of the world's fastest supercomputers, at Oak Ridge National Laboratory. SEACISM's aim is to use state-of-the-art simulation to predict the behavior of ice sheets under a changing climate by developing scalable algorithms.

"Right now we don't know enough to predict the dynamics of the ice sheets," said ORNL computational Earth scientist Kate Evans, who leads the SEACISM project. Included in the team are other scientists from ORNL, Los Alamos National Laboratory, Sandia National Laboratories, New York University and Florida State University. Their goal is to address this lack of understanding by reducing uncertainties about climate and sea-level predictions through high-fidelity simulations that resolve important ice sheet features.

The Fourth Assessment Report of the Intergovernmental Panel on Climate Change did not provide a prediction of ice sheet fate due to a lack of data. Given the importance of building a predictive capability, the Department of Energy's Office of Advanced Scientific Computing Research created an initiative to meet that need. ASCR's Scientific Discovery through Advanced Computing program funded the Ice Sheet Initiative for CLimate ExtremeS to yield high-fidelity, high-resolution ice sheet models.

SEACISM is one of six projects launched from ISICLES, all of which respond to the national and international need to include better ice sheet dynamic simulations in Earth system models. Among other objectives, the projects will quantify uncertainties of dynamic predictions and develop models to efficiently use supercomputers. ASCR's Leadership Computing Challenge program granted SEACISM researchers 5 million processor hours on Jaguar, a leadership computing facility system capable of up to 2.3 quadrillion calculations per second. Another 1 million hours for SEACISM were allocated on Argonne National Laboratory's LCF supercomputer Intrepid, with a peak speed of 557 trillion calculations per second.

The scientists working on SEACISM are collaborating to extend Glimmer-CISM, a three-dimensional thermomechanical ice sheet model that has recently been incorporated into the Community Earth System Model. CESM is a coupled global climate model comprised of atmosphere, land-surface, ocean, and sea-ice model components. SEACISM researchers are using the hours allocated in 2010 to prepare for the inclusion of the ice sheet model in simulations run as part of the Climate-Science End Station, an Innovative and Novel Computational Impact on Theory and Experiment, or INCITE, project that runs on the LCF systems.

"We need SEACISM to be working efficiently on LCF systems by next year," Evans said. The team is running test cases to validate newly developed model features. Once the code reproduces previous results, the team will move on to cases of increasing size and complexity. More detailed equations and finer grids build more complexity into the model, which allows better resolution of features such as the grounding line, a crucial juncture at which the floating ice shelf meets the land surface below it.

The SEACISM team is working on several journal articles about its research and will present intermediate results to the CESM's Land Ice Working Group in Boulder, Colo., in January. It hopes the model improvements will allow climate scientists to provide simulation data about ice sheet dynamics that will inform the next IPCC assessment report, expected in 2013.

Collaboration is first to be inked at OSU under multi-university agreement

The Ohio Supercomputer Center (OSC) has signed a collaboration agreement with the Procter & Gamble Company, enabling the two to work together on modeling and simulation projects aimed at accelerating innovation collaboration between industry and academia. The collaboration is the first at The Ohio State University enacted under P&G's master alliance agreement with Ohio colleges and universities.

Procter & Gamble (P&G) uses supercomputer modeling and simulation techniques in the research and development of many of its leading commercial brands, which include Tide, Pampers Pringles, Dawn, Downy and Mr. Clean. The company has used supercomputers to create higher speed production lines for its Pringles potato crisps; improve the quality of its diapers; and develop detergent with more soapsuds.

"Ohio State works hard to develop industry-academic partnerships that drive the state's economic competitiveness to new heights," said Caroline Whitacre, vice president for research at Ohio State. "Having the innovative resources of the Ohio Supercomputer Center located at Ohio State and being able to help drive research innovation at an industry powerhouse such as P&G are the types of collaboration we seek to foster."

Under the terms of the two-year master alliance agreement, the OSC will provide P&G with access to the center's supercomputational systems and collaboration on modeling and simulation projects. OSC's "Glenn" Cluster flagship supercomputing system features 9,500 cores, 24 terabytes of memory and a peak computational capability of 75 teraflops.

"This critical partnership accelerates the innovation process so that we can propel better-designed products into the global marketplace," said Tom Lange, director of corporate research and development modeling and simulation at P&G. "This project is aimed at making us more competitive, while also providing significant benefit to the university community by furthering its educational and research objectives."

OSC's widely recognized industrial outreach program, Blue Collar Computing, provides modeling, simulation and analysis resources to businesses, both large and small, to refine their products to a degree that could not be achieved with in-house resources. More than 30 large and small companies have used OSC computational facilities, hardware, software and expertise to stay competitive in the international marketplace.

"This noteworthy project is a natural extension of the strategic partnership that OSC has had with P&G for many years," said Ashok Krishnamurthy, interim co-executive director at OSC. "Along with supporting our Blue Collar Computing program, this collaboration will enhance our ability to better serve Ohio industry."

A master alliance agreement between the Ohio State and Cincinnati-based P&G simplifies the legal process that the company and university uses to negotiate research projects, allowing innovative ideas to come to fruition faster. The agreement enables P&G to tap into research activities at universities more quickly, and gives universities the ability to work on industry-specific products and processes.

As part of the agreement, OSU and P&G engage in a continuing program that encompasses research, education, service, task oriented and general program support projects. As stated in the initial agreement, OSU and P&G start with the master contract framework when considering a specific project and need only to negotiate the project's unique terms, such as scope of work and financial issues. This process helps enable faster collaboration, 12-18 months ahead of similarly positioned agreements with universities in other states.

New 100Gbit/s-Optimized Coherent Express Layer Provides Unprecedented Capacity, Reach and Flexibility with End-to-End Service Management

ADVA Optical Networking has added a coherent expresslayer to its flagship FSP 3000platform. The new technology has been optimized for 100Gbit/s transmissionspeed and enables service providers to use optical network resources flexibly and on-demand. Close interworking with the IP/MPLS layer allows a massive increase in network scalability and efficiency. The feature set represents a new generation of agile optical core networksand includes the following three criticalelements:

  • ·       Optical layer fully optimized for 100Gbit/s coherent transmission technology– Besides the obvious benefit of increasing the capacity per wavelength, the true power of the technology lies in the extra link budget gained with coherent detection. To benefit from the extra link budget, the 100Gbit/s capabilities are complemented by cost-effective, compact and performance-optimized amplification schemes, all fully integrated into the control plane. The new 100Gbit/s “pipes” are not only bigger, but smarter as well, as theservice managerhas full control over the links.
  • ·       Latest ROADM technology– ADVA Optical Networking’s Reconfigurable Optical Add/Drop Multiplexer (ROADM) solution is based on modular building blocks that support colorless, directionless, contentionless and gridless configurations. Customers can opt to deliver any transport service on any port, over any wavelength, to any direction in a network. Integrated amplification provides lowest nodal loss and highest transmission performance. Like the 100Gbit/s technology, the ROADM is fully integrated into the control plane, allowing the service manager to dynamically alter paths as needed.
  • ·       End-to-end service and bandwidth management– To make full use of 100Gbit/s and ROADM technologies, ADVA Optical Networking has fully integrated them with a powerful control plane. The control plane acts as the messaging layer for ADVA Optical Networking’s Service Manager and allows providers to provision a service from end to end in a network, removing stress from the IP/MPLS layer. With full visibility at the routing layer and full control of the transport layer, the service manager is able to quickly bring up and/or modify any service between any two locations.

“Today’s present solution – simply adding more bandwidth – does not sufficiently solve the underlying capacity and efficiency problems,” stated Eve Griliches, managing partner at ACG Research. “Instead, service providers are asking for an agile and scalable approach with fewer sites, which will enable operators to architect networks with intelligence to increase their profitability in this increasingly competitive market. ADVA Optical Networking is addressing all of these issues.”

“The bandwidth demand in the core of our network is increasing at an accelerating pace,” said Joachim Bellinghoven, chief operating officer at Versatel. The company, one of Germany’s leading telecom service providers recently built out its 45,000km nationwide fiber network. “ADVA Optical Networking has been a trusted partner for many years.”

“Networks have become a critical element to life and business, for end uasers, enterprises and those service providers delivering the capacity,” explained Christoph Glingener, chief technology officer of ADVA Optical Networking. “We have one of the most mature control plane implementations in the industry, an extremely flexible ROADM architecture and have introduced new state-of-the-art 100G transmission technologies – the right ingredients to provide efficiency, scalability and automation in the core of the network. We are proud to deliver agile core transport functionality with our FSP 3000 platform, addressing critical needs in the backbone networks of our customers.”

The ADVA FSP 3000 is an Optical+Ethernet transport solution that complements all IP/MPLS packet engines to deliver efficient multi-layer next-generation packet transport. Offering a flexible WDM foundation, the FSP 3000 is designed to provide seamless network agility to resolve today’s core network constraints.

Charles Leiserson and his team are experts at designing parallel algorithms — including one for a chess-playing program that beat IBM’s Deep Blue.

Computer chips’ clocks have stopped getting faster. To maintain the regular doubling of computer power that we now take for granted, chip makers have been giving chips more “cores,” or processing units. But how to distribute computations across multiple cores is a hard problem, and this five-part series of articles examines the different levels at which MIT researchers are tackling it, from hardware design up to the development of new programming languages.

At its most fundamental, computer science is about the search for better algorithms — more efficient ways for computers to do things like sort data or filter noise out of digital signals. But most new algorithms are designed to run on serial computers, which process instructions one after another. Retooling them to run on parallel processors is rarely simple.
As head of MIT’s Supertech Research Group, Professor of Computer Science and Engineering Charles Leiserson is an old hand at parallelizing algorithms. Often, he explains, the best approach is to use a technique known as divide-and-conquer. Divide-and-conquer is a recursive technique, meaning that it uses some method to split a problem in half, then uses the same method to split those halves in half, and so on. The advantage of divide-and-conquer, Leiserson explains, is that it enables a computer to tailor an algorithm’s execution to the resources available. 

Given a computation that requires, say, 10,000 arithmetic operations and a processor with 100 cores, Leiserson says, programmers will frequently just assign each core 100 operations. But, he says, “let’s say, for example, that one of the processors was interrupted by another job to do something for a moment, so in fact, you had to run on 99 processors. But the software divided it into 100 pieces.” In that case, Leiserson says, “everyone does one chunk; one guy does two chunks. Now you’ve just cut your performance in half.” If the algorithm instead used divide-and-conquer, he says, “that extra chunk that you had could get distributed across all of the other processors, and it would only take 1 percent more time to execute.”

But the general strategy of divide-and-conquer provides no guidance on where to do the dividing or how. That’s something that has to be answered on a case-by-case basis.

In the early 1990s, as a demonstration of the power of parallel algorithms, members of Leiserson’s group designed a chess-playing program that finished second in the 1995 computer chess championship. In a squeaker, the MIT program — the only one of the top finishers not developed by a commercial enterprise — lost a one-game tiebreaker to the eventual winner; the third-place finisher, IBM’s Deep Blue, went on to beat world champion Gary Kasparov two years later.

In large part, a chess program is a method of exploring decision trees. Each tree consists of a move, all the possible responses to that move, all the possible responses to each of those responses, and so on. The obvious way to explore the tree would be to simply evaluate every move and the responses to it to whatever depth time allows. That approach would be easy to parallelize: Each core could just take a different branch of the tree. But some moves are so catastrophically bad that no competent player would ever make them; after a brief investigation, those branches of the tree can simply be lopped off. Parallelizing the pruning of a decision tree is more complicated, since different pathways need to be explored to different depths. The MIT program thus ranked possible moves in order of likely success and first explored the most promising of them; then it explored the alternative moves in parallel. But it didn’t need to explore the alternatives exhaustively, just far enough to determine that they weren’t as good as the first move. Exploring the first move, however, meant first evaluating the most promising response to it, and then evaluating the alternative responses in parallel, and so on, down several levels of the tree. Divide and conquer.

The divide-and-conquer strategy means continually splitting up and recombining data, as they’re passed between different cores. But this poses its own problems. One common means of storing data, called an array, is very easy to split in two; but combining two arrays requires copying the contents of both into a new array. An alternative is a data storage method called a linked list, in which each piece of data includes a “pointer” that indicates the location of the next piece. Combining linked lists is easy: At the end of one, you just add a pointer to the front of the next. But splitting them is hard: To find the middle of the list, you have to work your way down from the top, following a long sequence of pointers.

So Tao Benjamin Schardl, a graduate student in Leiserson’s group, developed a new method of organizing data, which he and Leiserson call a “bag.” Though not quite as easy to split up as arrays, bags are much easier to combine; though not quite as easy to combine as linked lists, they’re much easier to split up. By using the bag, Schardl and Leiserson developed an algorithm for searching trees that provides “linear speedup,” the holy grail of parallelization: That is, doubling the number of cores doubles the efficiency of the algorithm.


Charles Leiserson
Photo: Patrick Gillooly
In large part, a chess program is a method of exploring decision trees. Each tree consists of a move, all the possible responses to that move, all the possible responses to each of those responses, and so on. The obvious way to explore the tree would be to simply evaluate every move and the responses to it to whatever depth time allows. That approach would be easy to parallelize: Each core could just take a different branch of the tree. But some moves are so catastrophically bad that no competent player would ever make them; after a brief investigation, those branches of the tree can simply be lopped off. Parallelizing the pruning of a decision tree is more complicated, since different pathways need to be explored to different depths. The MIT program thus ranked possible moves in order of likely success and first explored the most promising of them; then it explored the alternative moves in parallel. But it didn’t need to explore the alternatives exhaustively, just far enough to determine that they weren’t as good as the first move. Exploring the first move, however, meant first evaluating the most promising response to it, and then evaluating the alternative responses in parallel, and so on, down several levels of the tree. Divide and conquer.

The divide-and-conquer strategy means continually splitting up and recombining data, as they’re passed between different cores. But this poses its own problems. One common means of storing data, called an array, is very easy to split in two; but combining two arrays requires copying the contents of both into a new array. An alternative is a data storage method called a linked list, in which each piece of data includes a “pointer” that indicates the location of the next piece. Combining linked lists is easy: At the end of one, you just add a pointer to the front of the next. But splitting them is hard: To find the middle of the list, you have to work your way down from the top, following a long sequence of pointers.

So Tao Benjamin Schardl, a graduate student in Leiserson’s group, developed a new method of organizing data, which he and Leiserson call a “bag.” Though not quite as easy to split up as arrays, bags are much easier to combine; though not quite as easy to combine as linked lists, they’re much easier to split up. By using the bag, Schardl and Leiserson developed an algorithm for searching trees that provides “linear speedup,” the holy grail of parallelization: That is, doubling the number of cores doubles the efficiency of the algorithm.

A new computing classroom and learning laboratory in The University of Texas at Austin's Flawn Academic Center is changing the way that statistics and scientific computing are taught at the university.

The Statistics and Scientific Computation Lab is a collaboration between the Division of Statistics and Scientific Computation (SSC) in the College of Natural Sciences and the Texas Advanced Computing Center (TACC). Both divisions recognized the need for a space on the main campus where instructors could teach topics with lecture and lab components integrated into an innovative teaching environment.

"The new lab embodies the increasing importance that statistics and scientific computation play in our lives," said Sheldon Ekland-Olson, director of the SSC. "This innovative facility is a marvelous testimony to interdisciplinary cooperation across campus and is a moment to celebrate. The University of Texas at Austin is once again providing students with access to cutting-edge educational resources."

The lab is outfitted with 32 Dell workstations with the latest processors and video capabilities. There are plans to use the space as a distance learning classroom for all 15 institutions that compose The University of Texas System.

"The new lab enables the tremendous expertise of UT Austin faculty, and researchers at TACC, SSC and other departments, to benefit UT Austin students across colleges, and eventually to share this expertise with students at other institutions in real time," said TACC Director Jay Boisseau. "The capabilities and flexibility of this lab enable us to teach in the most effective mixed modes of lecture and practice for a wide variety of topics in scientific computing."

The lab puts the right tools in the hands of students and readies them for graduate-level research.

Students are using Linux, a leading computer operating system that runs the 10 fastest supercomputers in the world, on the workstations in the lab. These workstations interact with a TACC supercomputer, providing students with practical experience in advanced computing technologies.

"Every student has a laptop or desktop, but they don't have a high-performance computing (HPC) environment, and that's what we're emulating on these workstations," said John Lockman, research associate at TACC. "Getting students to use the tools we use every day in HPC is a great step forward."

Top Company Best and Brightest Participate in Six Month Course

The University of California has begun the first session of its Engineering Leadership Program for Professionals. This six month program is being held in the Silicon Valley and is focused on providing leadership training to top engineers from leading technology companies, including: Applied Materials, Cisco, Facebook, Lam Research, NetApp, National Semiconductor and Yahoo. This is the first program of its type in the U.S.

“Engineering leadership is critical to the success of the best companies in the world,” said Ikhlaq Sidhu, the curriculum designer and lead professor for the program. “This program is designed to build on the strengths of top technologists and provide them with some key disciplines that will make them better engineers as well as leaders.”

The program comprises twenty-eight, 3-hour sessions to be held weekly from January through the July of 2011. The goals of the program are to teach engineers to expertly manage technical teams, influence top-level strategy, and amplify the inherent value of R&D. The subjects covered will include: opportunity recognition, technical firm strategy, product management, customer development, operations, leadership skills, and finance. The sessions include cases presented by both U.C. Berkeley faculty and co-lecturers from industry, including: Charles Giancarlo, Charles Huang, Jerry Fiddler, and Sabeer Bhatia.

Said Charles Giancarlo, Managing Director of Silver Lake and former Chief Development Officer, Cisco, “I am a great fan of this program and believe that many companies in the valley can make use of it to meet the needs of engineering and marketing managers as they rise through the ranks. There is nothing like this anywhere.”

Speaking on the topic of the complementary programs offered by Berkeley’s Fung Institute for Engineering Leadership, Shankar Sastry, Dean of the Berkeley’s College of Engineering said, “Technology has the power to change how we live – but only if technologists have the tools and skills to lead these changes.”

The approximately 50 participating engineering leaders have been recommended and sponsored by their companies. The candidates included senior managers, directors, and key technical leaders. According to Prof. Sidhu, Founding Chief Scientist of the Fung Institute for Engineering Leadership and Director of the Center for Entrepreneurship & Technology (CET), “Our goal is to lead thinking in the importance of the role of engineering leadership to business success.”

More information about the Engineering Leadership Program for Professionals can be found at http://cet.berkeley.edu/professional or contact Keith P. Gatto, Program Director at kgatto@berkeley.edu.


Wave2Wave introduces a new high-performance wavelength-division multiplexing (WDM) passive optical system supporting coarse wavelength division multiplexing (CWDM) and dense wavelength division multiplexing (DWDM) aggregations of up to 20 and 40 channels respectively.

w-Lucid : increases the bandwidth transported by a single fiber link up to 400 Gb/s but without the cost and complexity of adding new network infrastructure.

Cisco recently reported that mobile data traffic is expected to grow nearly 40 times by 2014 as cellular wireless technology transitions from the 3G to the faster 4G/LTE standard. At the same time, storage demands, social networking and IT compliance are collectively taxing already limited bandwidth and network resources and forcing enterprises, service providers and carriers to add capacity and network infrastructure at unprecedented rates.

"Wave2Wave continues to lead the marketplace with innovative and intelligent solutions that help customers fully leverage their data center infrastructure," said David Wang, CEO, founder and President of Wave2Wave. "With the introduction of w-Lucid, enterprises, carriers and service providers can now increase their bandwidth at a fraction of what it would normally cost otherwise."

w-Lucid´s benefits include.

- Permits rapid network expansion at nominal cost;
- Allows deployment of less fiber and network infrastructure;
- Makes better efficient use of existing installed fiber plant;
- Does not compromise network performance or integrity;
- Interoperates seamlessly with next generation passive optical networks (PON);
- Is protocol agnostic and supports mixed network traffic types.

A leading publicly traded collocation services organization selected the Wave2Wave solution to interconnect their global network of data centers.

They chose w-Lucid because of the significant cost savings it provided over the traditional methods of installing more fiber cables or leasing new ones.

Wang continues "The product is a passive optical system, requiring no network management and maintenance efforts; it dramatically simplifies network architecture."


Wave2Wave will be showcasing w-Lucid at Teladata´s Technology Convergence Conference (booth #129) at the Santa Clara Convention Center on February 23. The company is also exhibiting its w-Metro : TM family of modular, mobile data center and other network solutions.

Wave2Wave products and solutions have consistently been recognized for excellence, including a 2010 supplier award from Brocade.


The National Institute of Standards and Technology (NIST) is teaming up with Willow Garage, a Silicon Valley robotics research and design firm, to launch an international “perception challenge” to drive improvements in sensing and perception technologies for next-generation robots.

robot's  eye view
This "robot's eye view" shows how some common household objects appear through the vision system being used in the Perception Challenge. The objects are fuzzy because the cameras have limited resolution. However, the images do provide information on depth (distance of every point on an object). The checkered patterns help to define and verify objects in space.
Credit: Courtesy Willow Garage
View hi-resolution image

“Perception is the key bottleneck to robotics. This competition will progressively advance solutions to perception problems, enabling ever wider applications for next-generation adaptive, sensing robots” says Willow Garage senior scientist Gary Bradski.

The competition will debut at the IEEE International Conference on Robotics and Automation (ICRA) 2011, to be held in Shanghai, China, on May 9-13, 2011. It will join three other competitions: updated versions of two other robotics competitions previously developed by NIST—the Virtual Manufacturing Challenge and the Micro-Robot Challenge—and the Modular and Reconfigurable Robot Challenge, a collaborative effort by the National Aeronautics and Space Administration (NASA) and the University of Pennsylvania.

The new competition will measure the performance of current algorithms that process and act on data gathered with cameras and other types of sensing devices, explains NIST computer scientist Tsai Hong. “There are hundreds—maybe even thousands—of algorithms that already have been devised to help robots identify objects and determine their location and orientation,” she says. “But we have no means for comparing and evaluating these perceptual tools and determining whether an existing algorithm will be useful for new types of robots.”

Willow Garage is putting up cash awards for excellent performers. The prize money grows exponentially with performance reflecting the increasing difficulty of each new increment in capability. The top prize is up to $7,000, awarded for successful completion of all tasks within the allotted time.

All contestants will receive a common set of about 35 objects for training and tweaking their algorithms. During the competition, teams will be evaluated on how well their solutions identify and determine the positions of these 35 objects plus an additional set of 15 objects for validation. NIST also will inform contestants of the metrics and methods they are developing for the competition.

Robust perception is a core enabling technology for next-generation robotics being pursued for a variety of applications. Many of these applications will require operating in unstructured and cluttered environments. For anticipated uses ranging from advanced manufacturing to in-home assistance for the elderly, to search-and-rescue operations at disaster sites, robots must be able to identify objects reliably and determine their position accurately.

The practical goals of this and future perception challenges are to determine what solutions already exist for particular robot-performed jobs, and to push the entire field to develop more dynamic and more powerful perception systems critical for next-generation robotics. NIST, a pioneer in developing metrics for evaluating and comparing robots and other automated technologies, has designed a variety of competitions intended to focus research and stimulate innovation in technology areas critical to improving the capabilities of robots.*

Techniques and metrics demonstrated in these competitions provide foundations for new standards and test methods for measuring perception system performance. As is true for the other competitions, the perception challenge will grow in difficulty with each passing year.

Willow Garage of Menlo Park, Calif., will provide a common system for testing competitors’ perception algorithms. Visual information and other environmental data will be gathered and communicated by off-the-shelf sensing technologies, and will be evaluated on Willow Garage's Personal Robot 2 (PR2) platform.

The deadline for entering is April 15, 2011, and final submissions are due May 1, 2011.

For more information on the perception challenge and instructions for entering, go to: http:/opencv.willowgarage.com/wiki/SolutionsInPerceptionChallenge.

* For example, see: http://www.nist.gov/el/isd/ks/response_robot_test_methods.cfm and http://www.nist.gov/pml/semiconductor/robots_042710.cfm.