


Tyler O'Neal, Staff Editor
Amazon’s second-quarter 2026 financial results highlight a pivotal shift in modern technology: the era of artificial intelligence is fundamentally becoming the era of supercomputing. While Wall Street focuses on quarterly earnings, the more significant development for the high-performance computing (HPC) community is the unprecedented investment by Amazon Web Services in AI infrastructure. This capital-intensive strategy is effectively reshaping the future of scientific research, enterprise AI, and cloud-based supercomputing.
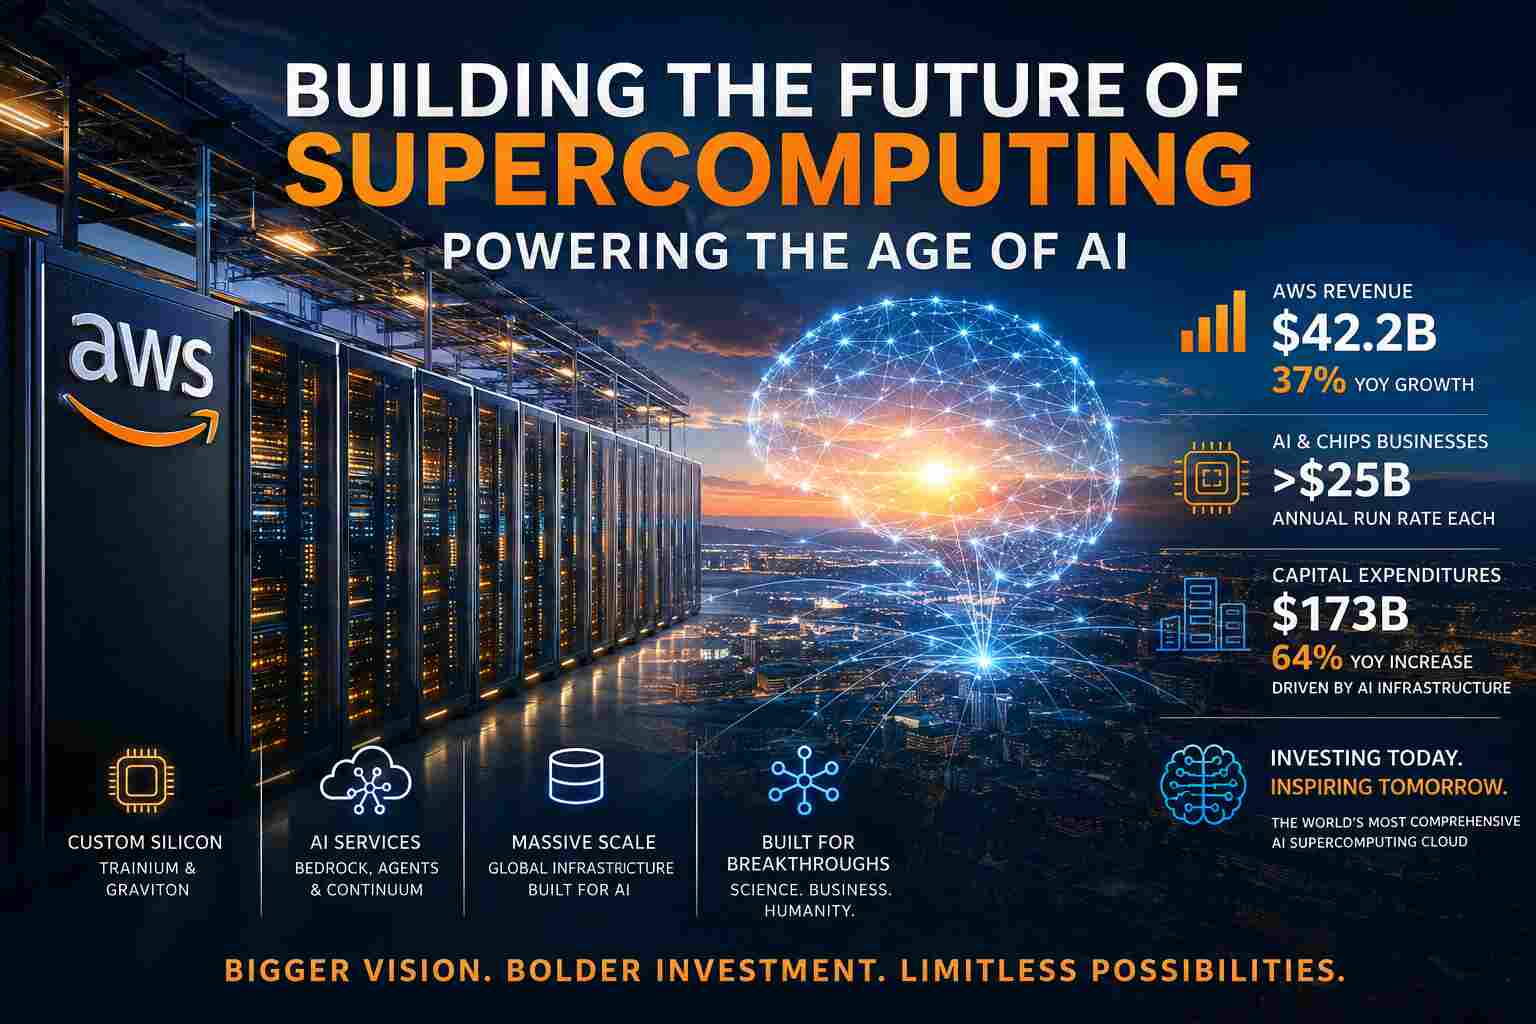
AWS delivered one of its strongest performances in years, reporting 37% year-over-year revenue growth to $42.2 billion, its fastest expansion in 18 quarters. The business now maintains an annualized revenue run rate of $169 billion, illustrating the massive demand for cloud infrastructure capable of training and deploying next-generation AI models. For researchers, enterprises, and national laboratories that increasingly rely on cloud-scale resources, the message is clear: Amazon is investing at a scale rarely seen in computing history.
AI has become a supercomputing business.
Artificial intelligence is often discussed in terms of chatbots and generative models. Behind every breakthrough, however, lies an extraordinary amount of computational power.
Every frontier AI model requires:
- Hundreds of thousands of CPUs
- Tens of thousands of AI accelerators
- Exabyte-scale storage
- Ultra-high-speed networking
- Massive electrical infrastructure
- Advanced cooling technologies
In other words, AI has become one of the world’s largest consumers of supercomputing resources. AWS now sits squarely at the center of this transformation.
CEO Andy Jassy highlighted the momentum, noting that AWS is experiencing its fastest growth in years while both its AI and custom silicon businesses have each surpassed $25 billion annual revenue run rates, demonstrating that customers are investing heavily in Amazon’s AI ecosystem.
Capital expenditures tell the real story.
While revenue growth grabbed headlines, Amazon’s capital expenditures reveal an even more important trend for the supercomputing industry.
During the trailing twelve months, Amazon invested approximately $173 billion in property and equipment, a 64% year-over-year increase. The company explicitly attributes the increase primarily to investments in artificial intelligence infrastructure. Those investments drove free cash flow negative despite record operating cash flow, a deliberate decision to accelerate AI capacity.
That level of investment is remarkable.
Rather than maximizing near-term free cash flow, Amazon is choosing to deploy capital into:
- AI supercomputer clusters
- Next-generation hyperscale data centers
- Advanced networking fabrics
- Purpose-built AI silicon
- High-density storage systems
- Next-generation cooling infrastructure
For the HPC community, these investments represent the construction of tomorrow’s computational backbone.
AWS is building more than a cloud
AWS increasingly resembles one of the world’s largest distributed supercomputers.
Its growing infrastructure supports:
- Scientific simulations
- Drug discovery
- Climate modeling
- Large language models
- Industrial digital twins
- Autonomous robotics
- Engineering simulations
- National-scale AI initiatives
The distinction between “cloud computing” and “supercomputing” continues to blur.
Instead of purchasing billion-dollar supercomputers every decade, organizations increasingly rent access to hyperscale AI infrastructure on demand.
AWS has become one of the primary enablers of that shift.
Custom silicon strengthens Amazon’s HPC position.
One of Amazon’s biggest strategic advantages lies in its rapidly expanding custom silicon portfolio.
The company reported strong momentum behind its Trainium AI accelerators, with multi-year, multi-gigawatt commitments from Anthropic and OpenAI, along with adoption by a growing roster of AI startups and enterprise customers.
Amazon also highlighted the general availability of Graviton5, delivering up to 25% higher compute performance than its predecessor and improved price-performance for cloud workloads. Graviton processors are now used by 98% of the top 1,000 EC2 customers, underscoring their growing importance in high-performance cloud computing.
For supercomputing users, custom silicon provides:
- Lower operating costs
- Improved energy efficiency
- Better workload optimization
- Greater scalability
- Reduced dependence on third-party processors
These advances are helping redefine what cloud-native supercomputing can achieve.
AI software demands HPC infrastructure.
Hardware alone is not driving AWS growth.
Amazon continues expanding its AI software ecosystem through services including:
- Amazon Bedrock
- Bedrock AgentCore
- AWS Continuum
- AWS DevOps Agent
- Lambda MicroVMs
- OpenSearch Serverless
The company added more than ten new foundation models to Bedrock, including OpenAI GPT-5.6, Anthropic Claude Opus 5, Google DeepMind Gemma 4, and Grok 4.3, while reporting that Bedrock usage has accelerated dramatically, with hundreds of thousands of customers and Q2 spending exceeding all prior quarters combined.
Each of these services depends on enormous computational infrastructure operating behind the scenes.
As AI agents become more autonomous, demand for scalable HPC resources is expected to increase further.
Strategic investments extend beyond hardware.
Amazon is also investing heavily in AI expertise.
The company announced a $1 billion investment to establish AWS Forward Deployed Engineering, embedding AI engineers directly with enterprise customers to accelerate deployment of agentic AI solutions. Initial customers include organizations ranging from research institutions to professional sports leagues and major enterprises.
While not a traditional capital expenditure, this investment strengthens the ecosystem that drives demand for AWS’s expanding supercomputing infrastructure.
AWS financial performance reflects infrastructure leadership
AWS generated:
- $42.2 billion in quarterly revenue
- 37% year-over-year revenue growth
- $16.6 billion in operating income
- 39.4% operating margin
- 64% growth in operating income year over year
These are not merely impressive financial statistics; they demonstrate that large-scale investments in AI infrastructure are translating into significant profitability and operational leverage.
As utilization rises across AWS’s AI platforms, the economics of hyperscale supercomputing continue to improve.
The future of supercomputing is being built today.
Amazon’s financial results reinforce an important reality for the HPC community. The world’s largest technology companies are no longer investing in AI as an experimental technology. They are investing in computational infrastructure on a scale comparable to national supercomputing initiatives.
These investments will accelerate:
- Scientific discovery
- Medical research
- Climate science
- Advanced manufacturing
- National security computing
- Autonomous systems
- Enterprise AI innovation
For SuperComputing News readers, AWS’s latest quarter is more than an earnings report; it is evidence that hyperscale cloud providers are becoming the architects of the next generation of global supercomputing.
The record capital expenditures may weigh on short-term free cash flow, but they also represent one of the largest sustained infrastructure investments in computing history. As AI workloads continue to expand, Amazon is positioning AWS to provide the computational foundation for researchers, enterprises, and governments alike.
The optimistic takeaway is unmistakable: the future of supercomputing is not slowing down; it is accelerating, fueled by bold investment, custom silicon, cloud-scale innovation, and an unwavering commitment to building the AI infrastructure that will power the next decade of discovery.

