As Philadelphia strives to meet greenhouse gas emissions goals established in its 2050 Plan, a better understanding of how zoning can play a role in managing building energy use could set the city up for success. Researchers in Drexel University’s College of Engineering are hoping a machine learning model they’ve developed can support these efforts by helping to predict how energy consumption will change as neighborhoods evolve.
In 2017, the city set a goal of becoming carbon neutral by 2050, led in large part by a reduction in greenhouse gas emissions from building energy use – which accounted for nearly three-quarters of Philadelphia’s carbon footprint at the time. But the key to meeting this mark lies not just in establishing sustainable energy use practices for current buildings, but also in incorporating energy use projections into zoning decisions that will direct future development.
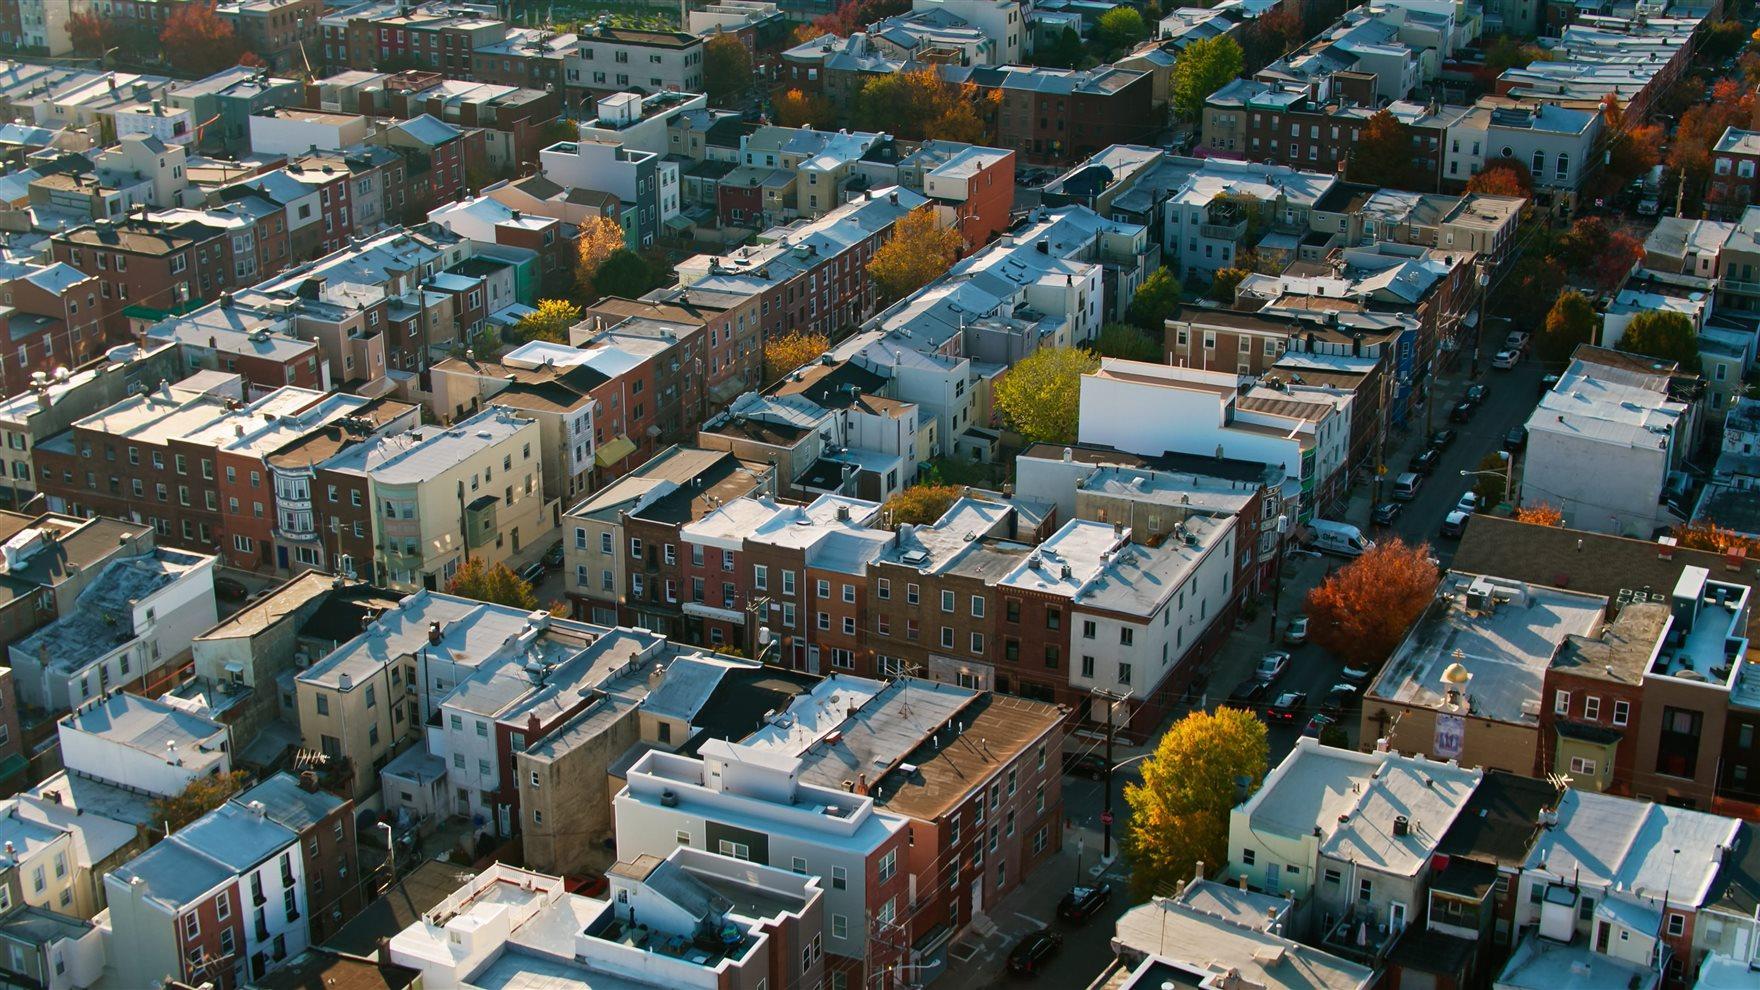
And the challenge for Philadelphia, one of the oldest cities in the country, is that building types vary widely — as does their energy use. So planning for more efficient energy use at the City level is not a problem with a one-size-fits-all solution.
“For Philadelphia in particular, neighborhoods vary so much from place to place in the prevalence of certain housing features and zoning types that it’s important to customize energy programs for each neighborhood, rather than trying to enact blanket policies for carbon reduction across the entire city or county,” said Simi Hoque, Ph.D., a professor in the College of Engineering who led research into using machine learning for granular energy-use modeling.
Hoque’s team believes existing machine learning programs, properly deployed, can provide some clarity on how zoning decisions could affect future greenhouse gas emissions from buildings.
“Right now there is a huge volume of energy use data, but it’s often just too inconsistent and messy to be reasonably put to use. For example, one dataset corresponding to certain housing characteristics may have usable energy estimates, but another dataset corresponding to socioeconomic features is missing too many values to be usable,” she said. “Machine learning is well equipped to handle this challenge because they can iteratively learn and improve through the training process to reduce bias and variance despite these data limitations.”
To glean information from the disjointed data, the team developed a process using two machine learning programs — one that can tease out patterns from massive tranches of data and use them to make projections about future energy and a second that can pinpoint the details in the model that likely had the greatest effect on changing the projections.
First, they trained a deep-learning program, called Extreme Gradient Boosting (XGBoost), with volumes of commercial and residential energy-use data for Philadelphia from the U.S. Energy Information’s Residential Energy Consumption Survey and Commercial Buildings Energy Consumption Survey for 2015, as well as the city’s demographic and socioeconomic data from the U.S. Census Bureau’s American Communities Survey for that time period.
The program learned enough from the data that it could draw correlations between a laundry list of variables, such as the density of buildings, the population of a given area, building square footage, number of occupants, how many days heating or air conditioning was used, and energy use for each house or building.
While deep learning models like XGBoost are very useful for making informed forecasts, given a large and inconsistent set of data, their methods can be obscured by the complexity of the operations they perform. But to be a useful tool for guiding planners, the team needed to unpack the so-called “black box” program enough to turn its projections into recommendations.
To do it, they employed a Shapley additive explanations analysis, an assessment used in game theory to distribute credit among factors that contributed to an outcome. This allowed them to suss out how much a change in building density or square footage, for example, factored into the program’s projection.
“Machine learning models like XGBoost learn how to chug through datasets to fulfill a specific task — like generating a reliable forecast of a system — but they do not claim to really understand or represent the on-the-ground relationships that underlie a phenomenon,” Hoque said. “And while a Shapley analysis cannot tell us which features have the greatest impact on energy use, it can explain which features had the greatest impact on the model’s energy use prediction, which is still quite a useful piece of information.”
Then the team put the model to the test by providing input data from a hypothetical scenario proposed by the Delaware Valley Regional Planning Commission that estimated continuing economic development in Philadelphia through the year 2045. The scenario suggested a 17% population increase with a commensurate increase in households, and it presents a number of different possibilities for employment and income by region throughout the city.
For each scenario, the model projected how new residential and commercial development would change greenhouse gas emissions from building energy use throughout 11 different parts of the city and which variables played prominent roles in making the projections.
Looking specifically at residential energy use for the 2045 scenario, the program suggested that six of the 11 areas would decrease their energy use – mostly lower-income regions. While mixed-income regions, like the northernmost part of the city, including Oak Lane, would likely see an increase in energy use.
According to the Shapley analysis, the presence of single-family attached (lower energy use) versus detached (higher energy use) dwellings played an important role in the projections, with high monthly electricity cost, lot sizes of less than one acre, and lower number of rooms per building all contributing to lower energy use projections.
“Overall, the residential energy prediction model finds that features related to lower building intensity relate to lower energy consumption estimates in the model, for example, lower lot acreage, lower number of rooms per unit,” they wrote. “These results give reason to reinvestigate the effects of upzoning policies, commonly present as an affordable housing solution in Philadelphia and other cities across the U.S., and subsequent changes in energy use for these areas.”
On the commercial side of the scenario, the machine learning model did not project much change in energy use under the 2045 conditions — energy use for the largest commercial buildings remained high. And while it was limited to looking at just six variables — square footage, number of employees, number of floors, heating degree days, cooling degree days, and the principal activity of the building — due to the available data in the training set, the Shapley analysis pointed to building square footage and number of employees as the most important predictors of energy use for most types of commercial buildings.
“With respect to the commercial sector, the study suggests that commercial buildings in the top quantiles of square footage and employee count should be the primary targets for energy reduction programs,” the authors wrote. “The research posits an approximate threshold of 10,000 square feet of total building area, with buildings over that marker being prioritized due to their disproportionate influence on the energy prediction of the model.”
While the researchers caution against assuming a direct link between variables and energy use changes in the model, they suggest that it is still quite useful because of its ability to give planners both a high-level and granular look at the interplay of zoning decisions and development and their effect on energy use.
“I see a lot of potential in using machine learning models like XGBoost to forecast energy use increases or decreases due to new construction projects or policy changes,” Hoque said. “For example, building a new rail line in a neighborhood may change the demographics and employment of a neighborhood, and our methods would be ideal for incorporating that information in the context of an energy prediction model.”
The team acknowledges that more testing is necessary and the program will only improve as it is provided with additional data. They suggest that the next step for the research would be to focus on areas of the city with known high energy use and perform a Shapely analysis to discern some of the factors that could be contributing to it.
“We hope this will provide a resource for future researchers and policymakers so they don’t have to scope through the entire city of Philadelphia, but can hone in on neighborhoods and variables which we have flagged as areas of potential importance,” Hoque said. “Ideally, future studies would use more interpretable methods to test whether these features really correspond to higher or lower energy estimates in a given area.”