How to resolve AdBlock issue?
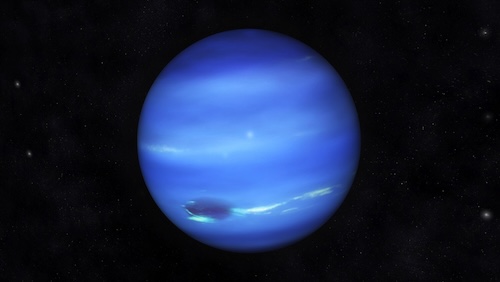
In a breakthrough that feels like cosmic archaeology, a research team at the University of Zurich (UZH) used cutting-edge supercomputer modeling to challenge decades-old assumptions about the icy giants of our solar system, Uranus and Neptune. The results? These planets might not be ice giants at all, but something far more surprising: worlds rich in rock and mystery.
Rebooting the “Ice Giant” Idea
For generations, scientists categorized Uranus and Neptune as “ice giants”, planets composed predominantly of water, ammonia, and methane ices beneath their atmospheres. Yet the new UZH study uses a hybrid modelling method that’s deliberately agnostic. Instead of assuming what’s inside, the computer starts with randomized internal profiles, then iterates until those profiles match known properties like gravity and density.
The outcome: both planets could just as plausibly be “rock-rich” as “ice-rich,” or somewhere in between. For Uranus, the models returned rock-to-water mass ratios ranging from ~0.04 up to nearly 4, a huge spread. Neptune’s best fits suggest similar ambiguity.
Modeling a planet’s interior is not trivial. You must simulate pressure, temperature, chemical composition, mass distribution, and gravitational moments, all under conditions that can’t be replicated on Earth. The UZH team used iterative algorithms that try countless plausible internal configurations, discard what doesn’t fit, and refine what does. This kind of brute force analysis demands enormous computational power.
It’s the same principle that has transformed cosmology and planetary science: powerful hardware + clever software = a time machine for the universe’s hidden corners. Much like how supercomputers once helped simulate star and galaxy formation for researchers at UZH and beyond.
A New View of Magnetic Fields and Planetary Identity
One of the strangest facts about Uranus and Neptune is their bizarre, multipolar magnetic fields, nothing like Earth’s simple dipole. The new models offer a possible explanation: if the interiors are layered differently than assumed, with rock-rich regions and various convective zones, magnetic field generation could behave differently than before thought.
In other words, these planets’ internal structure, not just external appearance, may be far more diverse than “ice giants.” They might be “rock giants,” “mixed giants,” or something in between.
- The conclusions don’t assert Uranus or Neptune must be rock-heavy. Rather, they show that with current data, multiple internal configurations remain plausible.
- As researchers note, uncertainties remain, especially regarding how materials behave under extreme interior pressures and temperatures, and exact composition gradients.
- Definitive answers likely require future space missions to Uranus or Neptune to collect more observational data.
Because this work flips our assumptions. For decades, Uranus and Neptune comfortably sat in a neat box: “ice giants.” Now, thanks to computational bravery, that box is dissolving. These planets, mysterious, blue, distant, become laboratories for possibility.
Think about it: we can’t drill into them or bring back samples. We can’t replicate their interiors on Earth. But with enough processing power and creative algorithms, we can peer inside. It’s a reminder: sometimes the most radical discoveries aren’t from better telescopes, but from better simulations. The cosmos doesn’t always give answers, so we build them ourselves.
This kind of research, agile, computational, wide-open to possibilities, invites a rethinking of how we categorize planets, how we understand planet formation, and even how we search for exoplanets.
Maybe the neat categories we learned in school are just placeholders until someone powers up a supercomputer. And then: boom, the universe gets more weird, more beautiful.