How to resolve AdBlock issue?
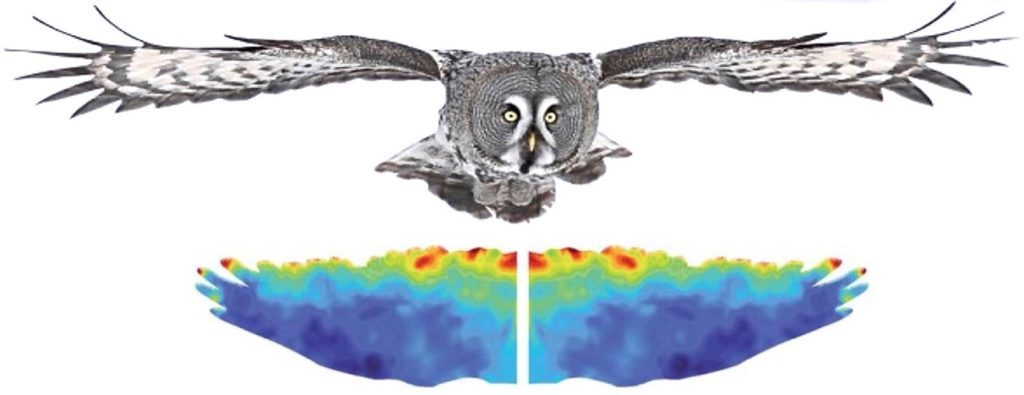
Owls have always fascinated us with their ability to fly silently. Their wings make no noise, allowing them to hunt their prey undetected. Yet, we've never fully understood how they manage to fly without making a sound. That is, until now, thanks to the groundbreaking research conducted by a team of scientists at Chiba University.
Using computational fluid dynamic simulations, the researchers shed light on the enigmatic world of silent owl flight. Led by Professor Hao Liu from the Faculty of Engineering and the Center for Aerial Intelligent Vehicles, they embarked on a mission to understand the intricate details of this astounding phenomenon.
The team started by studying micro-fringes found on owl wings, which led them to question their impact on sound and aerodynamic performance. With advanced simulation techniques, the team meticulously analyzed the effects of these micro-fringes using the principles of computational fluid dynamics.
The results of their simulations were astonishing. The team discovered that the micro-fringes on owl wings effectively suppress noise while maintaining aerodynamic performance comparable to wings without such fringes. Through the interplay of two complementary mechanisms, these fringes enhance airflow and reduce fluctuations, resulting in a reduction of noise production.
Professor Liu explained that their findings demonstrate the intricate interactions between the micro-fringes and various wing features, validating their potential use in reducing noise in practical applications such as drones, wind turbines, propellers, and even flying cars. This research paves the way for the development of advanced biomimetic designs that could revolutionize the field of low-noise fluid machinery.
The implications of this study extend far beyond the realm of silent owl flight. It shows that by harnessing the secrets unveiled through these simulations, we can develop sustainable technology that prioritizes energy and resource-saving manufacturing.
Professor Liu's research aligns with the B3 strategy, a fusion of biomechanics, biomimetics, and bioinspiration. Through this approach, he aims to uncover the fundamental principles underlying the diversity, optimality, and robustness of biological movements. By learning from nature, we can create bio-inspired engineering solutions that drive significant advancements in various fields.
In conclusion, the silent wings of owls exemplify the exquisite craftsmanship of evolution. Through computational fluid dynamics, we can unlock even greater potential. Professor Liu and his team's work represents a triumph of scientific exploration and technological innovation. It reminds us that by studying the marvels of the natural world, we can unveil the secrets to overcoming our greatest challenges.